Collecting Phoenix's Telemetry.Metrics with Prometheus
I recently rebuilt this site with Phoenix and hosted it on Fly.io (where I’m working). As part of this, I was curious about practical uses for the telemetry events that are included in Phoenix and the other libraries. In order to observe the application’s performance, I wanted to get the telemetry data somewhere it could be observed. Fly.io provides managed Prometheus and Grafana, so I figured this would be the easiest path forward.
Why export Telemetry.Metrics to Prometheus?
Out of the box, Phoenix adds some basic telemetry metrics that LiveDashboard displays in the performance tab. While LiveDashboard is useful while you’re looking at it, the metrics it displays are not persisted so we can’t view them over time or use them for alerting.
I had originally looked into OpenTelemetry because I like the idea of open standards. However, for what I want to do (get metrics into Grafana), it wasn’t the right fit. I don’t need the tracing aspects and getting open telemetry data into a format that Prometheus could deal with was not straightforward.
First, I tried
telemetry_metrics_prometheus,
but it raised exceptions when trying to use distribution metrics.
I settled on Peep, which is listed in the
Reporters section of the
Telemetry.Metrics readme.
This library worked and does what I need it to – take metrics and turn them
into something Prometheus can scrape.
What Are We Gonna Do?
To make this work, we need to get metrics into Fly.io’s Prometheus instance, then those will be available in the managed Grafana instance.
Here’s what that looks like:
- Turn Phoenix’s metrics into a format that Prometheus can scrape
- Expose an endpoint that these metrics can be scraped from
- Do stuff with the metrics in Grafana
Everything past this point assumes you’ve got a Phoenix app with a
MyAppWeb.Telemetry module and the telemetry_metrics dependency installed
already.
Preparing telemetry for Prometheus consumption
For this, I chose Peep as it seems to be the most maintained option (and it
supports the distribution
metric type in Telemetry.Metrics).
Add it to your dependencies
(example commit)
and install it with mix deps.get. Now we need to change the default metric
types from summary, which isn’t supported by Peep, to last_value or
duration. Open up telemetry.ex and make these changes. Here’s a couple, for
example:
def metrics do
  [
    # Phoenix Metrics
    distribution("phoenix.endpoint.start.system_time",
      unit: {:native, :millisecond}
    ),
    distribution("phoenix.endpoint.stop.duration",
      unit: {:native, :millisecond}
    ),
    # others omitted for brevity

    # VM Metrics
    last_value("vm.memory.total", unit: {:byte, :kilobyte}),
    last_value("vm.total_run_queue_lengths.total"),
    last_value("vm.total_run_queue_lengths.cpu"),
    last_value("vm.total_run_queue_lengths.io")
  ]
end
Next, we need to add Peep to our telemetry supervision tree. Add the following
line to the list of children, but change the name to match your app’s name.
{Peep, name: MyAppPeep, metrics: metrics()}It should look something like this:
def MyAppWeb.Telemetry do
  @impl true
  def init(_arg) do
    children = [
      # Telemetry poller will execute the given period measurements
      # every 10_000ms. Learn more here: https://hexdocs.pm/telemetry_metrics
      {:telemetry_poller, measurements: periodic_measurements(), period: 10_000},
      # Add reporters as children of your supervision tree.
      # {Telemetry.Metrics.ConsoleReporter, metrics: metrics()}
      {Peep, name: MyAppPeep, metrics: metrics()},
    ]

    Supervisor.init(children, strategy: :one_for_one)
  end
end
Once that’s done, you can run iex -S mix and you can test this out by running
the following command:
iex(1)> MyAppPeep |> Peep.get_all_metrics() |> Peep.Prometheus.export()If that’s working, you’re ready to expose at an endpoint that Prometheus can scrape.
Exposing /metrics
We don’t want to make the metrics endpoint available publicly. I mean, you could… but I don’t want to, so I did some extra work to make sure no one can get it, except Prometheus.
First, write the plug that will serve these responses. I put it in
lib/my_app_web/telemetry/peep_plug.ex and it looks like this:
defmodule MyAppWeb.Telemetry.PeepPlug do
  use Plug.Router
  alias Plug.Conn

  plug :match
  plug Plug.Telemetry, event_prefix: [MyAppPeep, :plug]
  plug :dispatch

  get "/metrics" do
    name = MyAppPeep
    metrics = name |> Peep.get_all_metrics() |> Peep.Prometheus.export()

    conn
    |> Conn.put_private(:prometheus_metrics_name, name)
    |> Conn.put_resp_content_type("text/plain")
    |> Conn.send_resp(200, metrics)
  end

  match _ do
    Conn.send_resp(conn, 404, "Not Found")
  end
end
If you’re curious about what’s going on here, the docs for Plug.Router are a good read.
Next, we need a Bandit server. Head back to your telemetry supervisor in the
MyAppWeb.Telemetry module and we’ll add that to the supervision tree:
 def init(_arg) do
    children = [
      # Telemetry poller will execute the given period measurements
      # every 10_000ms. Learn more here: https://hexdocs.pm/telemetry_metrics
      {:telemetry_poller, measurements: periodic_measurements(), period: 10_000},
      # Add reporters as children of your supervision tree.
      # {Telemetry.Metrics.ConsoleReporter, metrics: metrics()}
      {Peep, name: MyAppPeep, metrics: metrics()},
      {Bandit, plug: MyAppWeb.Telemetry.PeepPlug, port: 9091}
    ]

    Supervisor.init(children, strategy: :one_for_one)
  end
Now, when you start your server with mix phx.sever, you should see two
different bandit endpoints starting.
If everything worked, visit http://localhost:9091/metrics and you’ll see some stuff that Prometheus can scrape. Hurah!
The last step is to tell Fly.io about these changes by updating your fly.toml
like this:
[[metrics]]
  port = 9091
  path = "/metrics"
Now fly deploy these changes.
Doing stuff with Grafana
Now we’ve got some stuff going on, you can open your metrics dashboard
fly dashboard metrics and then click on the “Open all on Grafana” button:

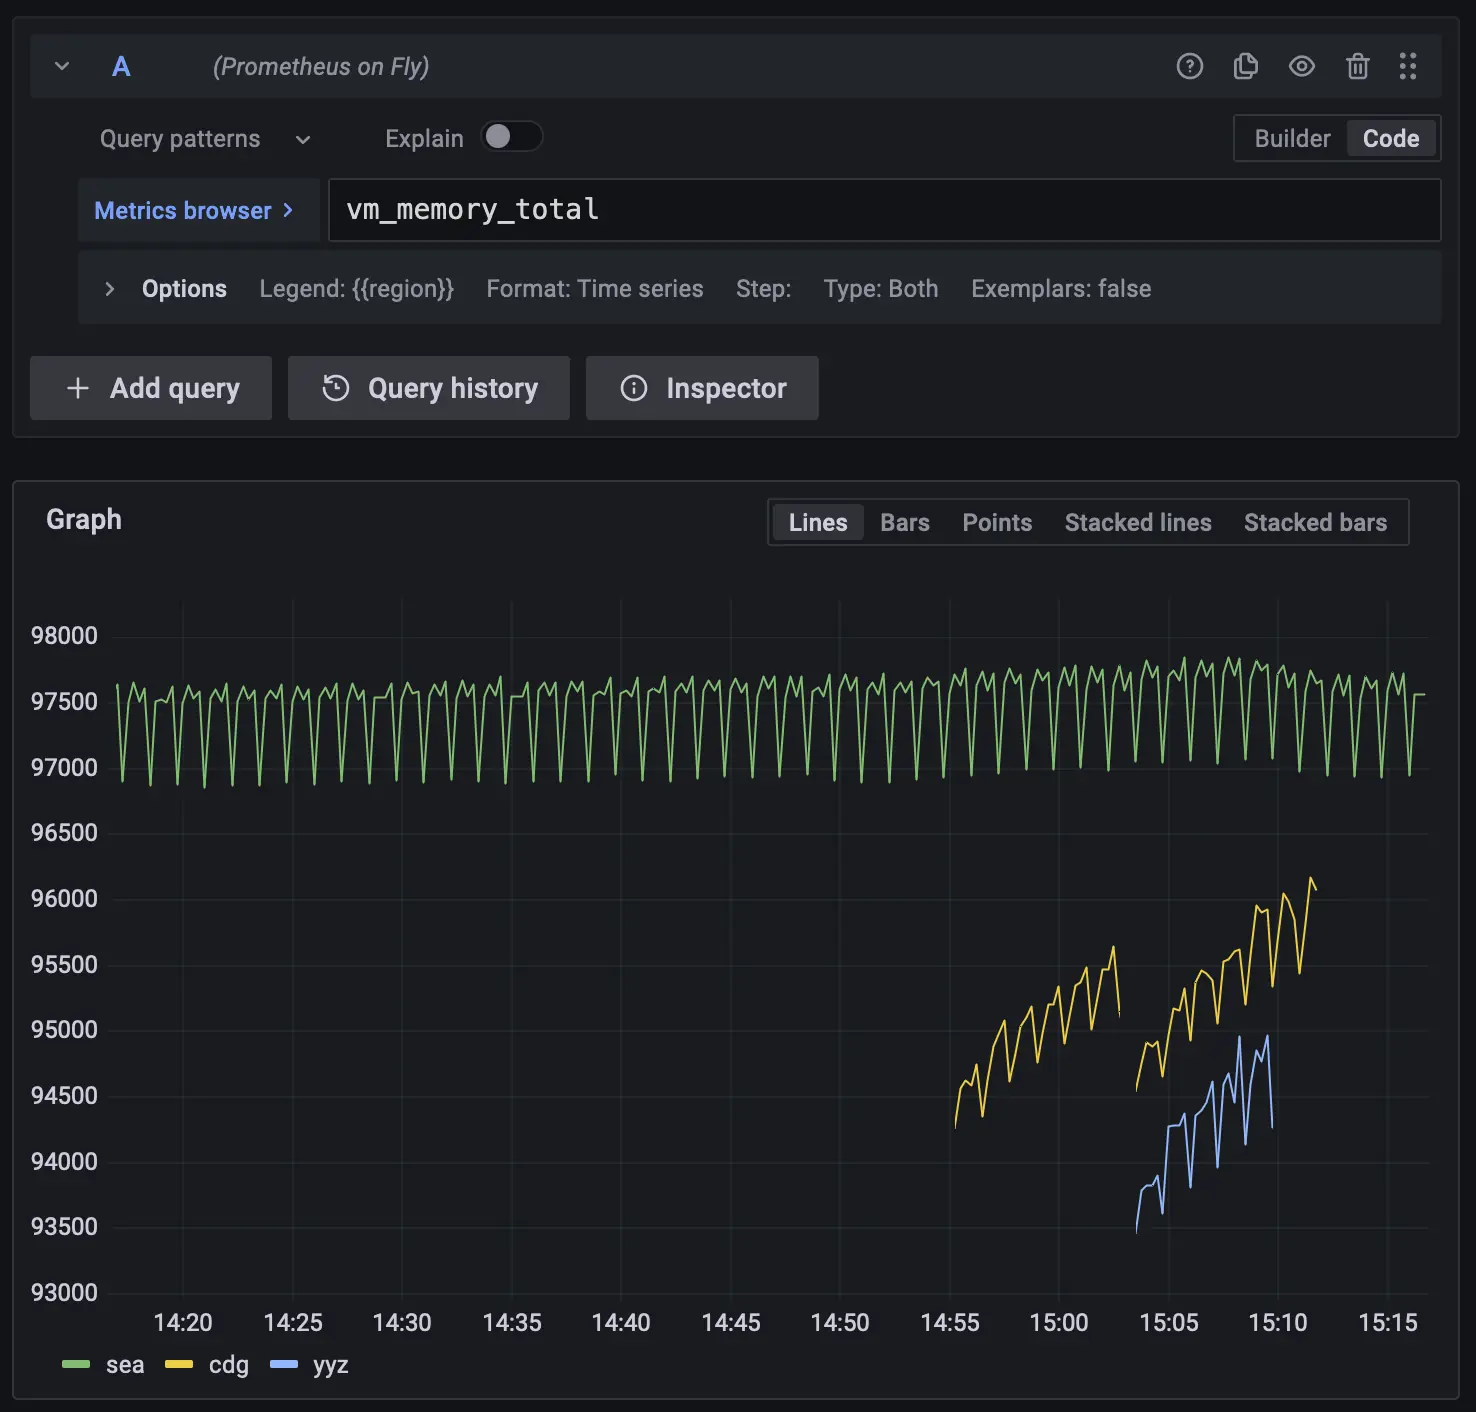
Head over to the explore tab in Grafana and search for one of the metrics you’re
now exporting. Here’s what my vm_memory_total now looks like:
That’s it!
For all the code, have a look at the commits on Github.
I think the next thing I’m going to try is setting up some site analytics around pageviews with telemetry in Elixir.